Visualizing the 200M Astonomy Ground-Truth/OCR Dataset
When “reading” scanned text with Optical Character Recognition (OCR) we are often left with messy results with wrong punctuation and a lot of misspellings. This can be an especially bit issue when trying to digitize historical scientific literature as there are many specialized words and characters.
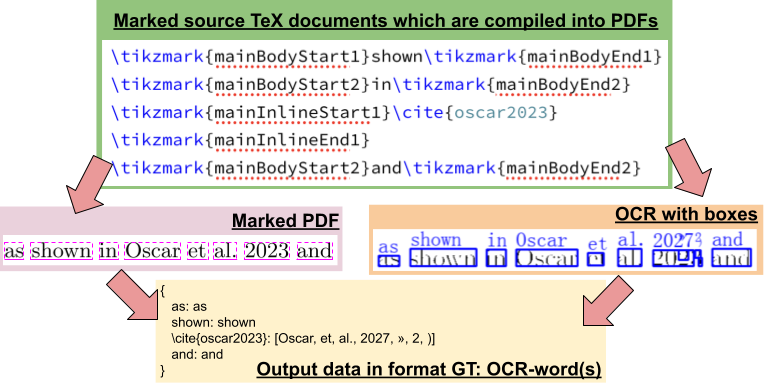
This project aims at addressing this by creating a large “synthetic” dataset that we can use to train machine learning models. We do this by “mining” the arXiv Bulk Downloads and finding the location of each word in each scientific document. We can then run the same documents through an OCR Engine, in this case Tesseract and see what the computer thinks each OCR word should be:
This work focuses on the Astronomy & Astrophysics literature (journals like MNRAS, ApJ & AJ) in the years 1991-2011 which is a subset of the full arXiv holdings in that time period:
Below we show the “confusion matricies” for several combinations of character and word pairs. To explore the dataset, click on a row to see the distribution of correct vs. incorrect characters and word combinations.
Character Level Plots
Alphabetical Characters
First, we look at the confusion matrix for alphabetical characters – Click on a row to show the character distribution histogram on the left. (Double click on grid heatmap to un-select):
“INSERT” refers to when a character has to be inserted in the OCR text in order to make it align correctly with the ground-truth text – i.e. the OCR engine has missed a character.
“DELETE” means a character has to be deleted in the ground-truth text in order to align correctly with the OCR text – i.e. the OCR engine has added an extra character by mistake.
Digit Characters
Now, let’s look at digits:
Punctuation
And now punctuation marks:
Word-Level Matches
Next we look at word-level matchs. Here we will be making use of a “cleaned” dataset in which the ground-truth words have all been made lowercase and have been cleaned of any leading or trailing punctuation.
Stopwords
Stop-words are some of the most frequent words in the English language. Here we show how accurate Tesseract is with these words in our dataset:
Because there are many stop-words, we plot the histogram with a dropdown not tied to the above matrix:
Note for plotting purposes, we exclude any words that occur less than 5 times in our ground-truth word list.
Frequent which are not stopwords
Below we show the 100 most frequent words in our dataset that are not stop-words.
And a dropdown for the distribution of these words:
Note for plotting purposes, we exclude any words that occur less than 5 times in our ground-truth word list.
Frequently misspelled words (not stopwords)
Finally, we can take a look at words that are frequently misspelled (that are not stopwords). There are a few ways to quantify this. Here, let’s only look at words that appear at least 10,000 times in our dataset (about 300 words in total). Then, we sort by how often each word is wrong (in %) and take the 100 “most wrong” of these words.
Again, we can use a dropdown to look at distributions word by word:
Note for plotting purposes, we exclude any words that occur less than 5 times in our ground-truth word list.